Release Note v.51.2
Release date: To be confirmed after the approval
New Features & Improvements Summary:
Section | Update summary |
|---|---|
Firmware |
|
Configuration updates | - |
Core services |
|
Firmware:
Updates:
Implemented 00.01.13.2 & 00.01.13.3 updates from Teltonika
Isolated allunite-setup network (doesn’t have access to the internet, just to routers ports 80 and 22)
Changed setup network SSID to “allunite-setup-xxxx” where xxxx is last 4 symbols from device LAN MAC address (lowercase)
Fixed accessing AllUnite router page from RMS
Added logging to events while restarting RMS connection or devmon process
Implemented configurable reboot/modem restart thresholds
Made QMI protocol the default for 4G modem connection
Implemented Maintenance page (http://sensor.allunite.com):
included RMS status section
included button for restarting RMS connection
the page is available when connected to the setup SSID
Validation:
Data Department has conducted 2-week field tests comparing the different versions of the firmware to ensure no data is impacted by the firmware update.
Firmware impact on data:
No impact.
Configuration Updates:
-
Core services:
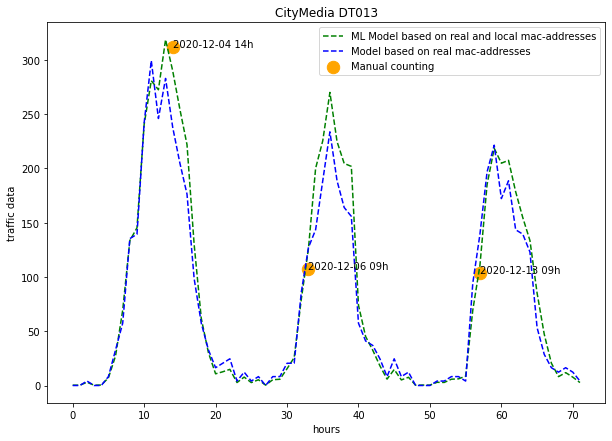
Improved traffic model
Updates: the current one-parameter model (linear regression model with the supervised learning) is enhanced with multiparametric machine learning model (explanatory variables such as low or high traffic period, the signal level of the device, etc.). This enhancement also includes basing the traffic data on both locally-administered and universal MAC addresses.
Validation: Based on AllUnite Data team’s lab tests based on a series of “manual countings” performed in a range of environments, we have observed (1) the strong correlation between the universal and locally-administered MAC addresses (the linear dependency) for a specific region or facility type (environment); (2) enriched the traffic model with the data points that allows improving the accuracy for the low and high traffic period.
Impact on data:
Accuracy improvement for locations with the high traffic.
The dataset will include 100% of devices (universal and locally-administered MAC addresses) in comparison to 30% of devices with the universal MAC addresses. The potential change in the total traffic is negligible.
Implementation of “noise” reduction algorithm
Updates: the “noise” reduction algorithm helps to detect and exclude abnormal or “noise” sessions. It is based on the Anomaly detection algorithm that contains 3-sigma rule by vendors and time-range:
where X is an observation from a normally distributed random variable, μ is the mean of the distribution, and σ is its standard deviation.
Validation: The AllUnite Data team has monitored the anomalies on the sensors for the last 18 months, distinguished and analyzed the singular cases. The "noise" traffic was excluded, and the final dataset was validated applying the analysis of total traffic dynamic trends per sensor and the algorithm of moving average.
Impact on data:
Significant reduction of the time of reaction to the anomaly events (“noise”) and timely exclusion of the noise traffic from the total data.
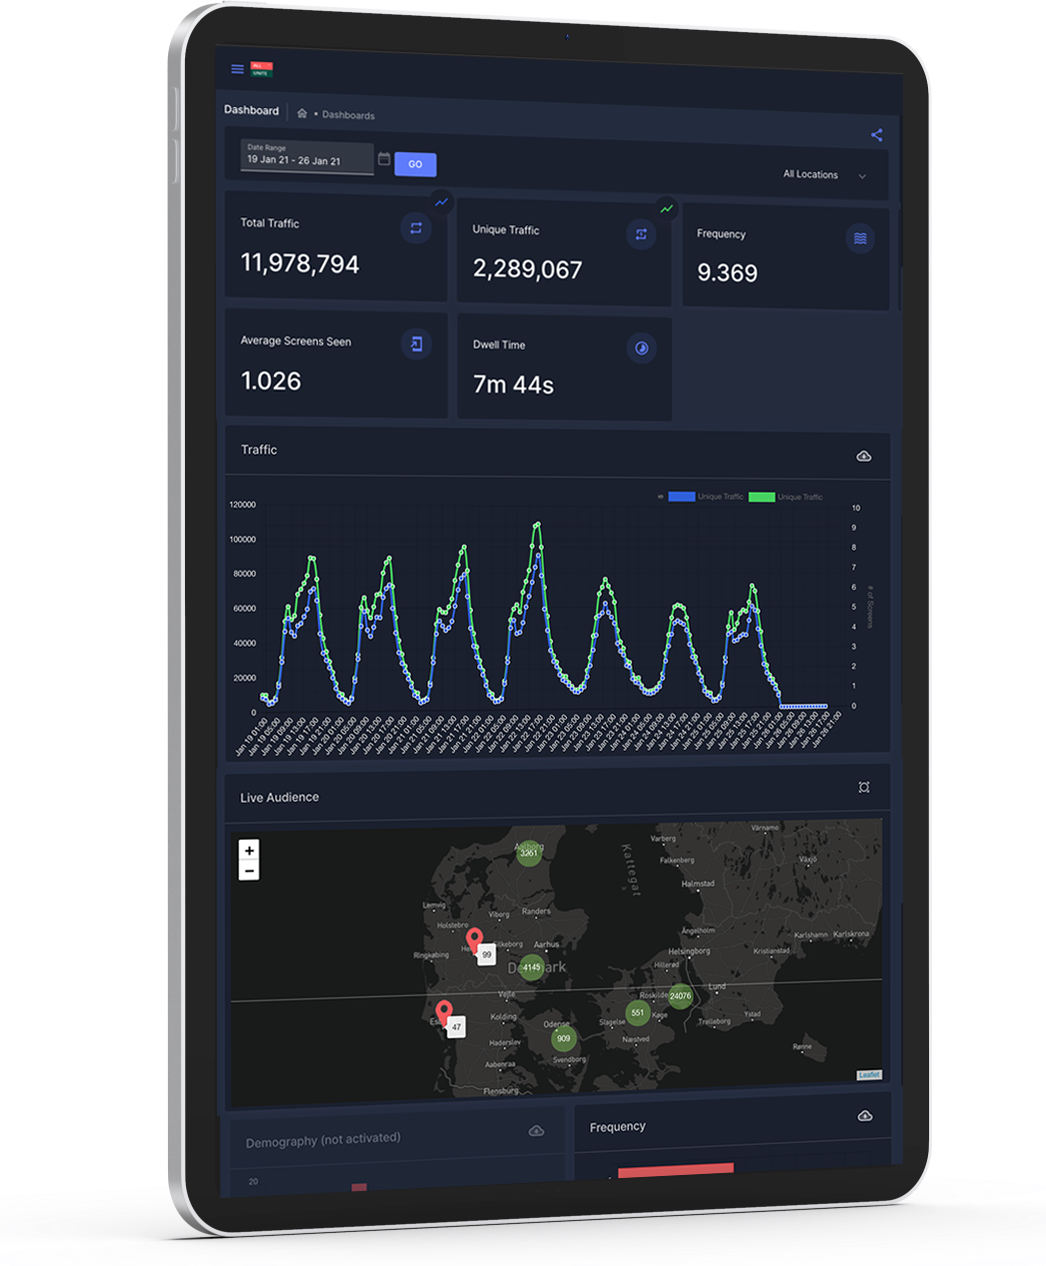
New Dashboard (http://analytics.allunite.com/)
The current dashboard located at mods.allunite.com has moved to analytics.allunite.com and got the new look, including the dynamic map of the live audience and responsive design (easy to use on mobile and tablet):
New Features & Updates:
New responsive Dashboard design
Significantly improved performance
Improved calendar
Users can choose:
different timezones to present the data
various metrics to be shown on the graph (one or multiple)
categories that include a group of sensors (i.e., Malls or Rail)
Added the real-time map with the amount of traffic per sensor
Added the export chart data function