RMS usage (read only)
The main page of RMS you can see on the picture below
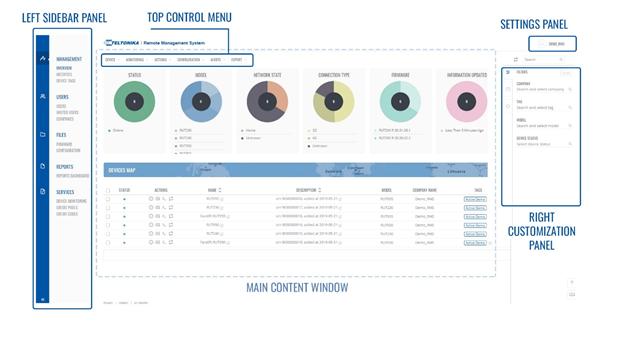
The main page of RMS consists of five main user interface elements. Manipulating left sidebar panel, top control menu and right customization panel you will see all the information in the main content window in the center of your screen.
· Left sidebar panel - provides access to different sections of RMS. Management, Users, Files, Reports, Services.
· Top control menu - Here you will find all options and controls depending on which tab of the left sidebar is currently selected. (Read only user do not see all menu)
· Right customization panel - Allows you to filter and customize what kind of data you will see in the main content window.
· Main content window - Shows all the data and corresponds to your selection on the left sidebar panel and customization of the right panel.
· Settings panel - Location for your RMS account username, user and profile settings and the option to log out.
Left sidebar panel
· Left sidebar panel tabs provide access to different sections of RMS. This is the main section of the RMS user interface, and it will always control the type of information you will see on the screen.
It consists of:
· Management — tab is your main tool of RMS. From here you can manage, monitor, update and configure all your devices, reports – can generate and store device reports
· Users — tab is used to manage RMS users and companies.
· Files — tab is for managing custom firmware files and configuration backup files.
· Services — tab allows controlling device monitoring options and RMS credits usage.
Each section of left sidebar panel. Has a subsection with specific topics for those specific sections.
Main content window
Similarly to the top control menu, the main content window corresponds to your selection on the left sidebar panel.
The main content for this tab has three different areas.
· Charts – displays a list of devices information in a graphical way. Shows all the pie charts that were selected in Chart options in the right customization panel.
· Devices map - clicking on the map enlarge icon will expand a world map with devices located on their approximate locations.
· Table section - displays different data columns, for your devices. You can customize what columns are displayed in the Right customization panel.
Charts and table section both can be filtered and changed using the right customization panel. For example, we can change what kind of columns will be shown in the table section.
Right customization panel
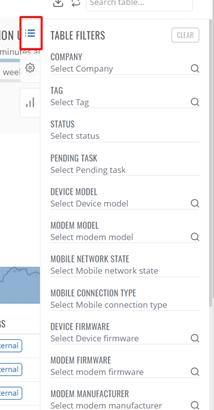
Right customization panel allows to filter and customize what kind of data you will see in the main content window.
In the filters tab, we can filter for companies, tags, models and device status.
Table columns tab gives you a lot of different options to choose specific columns you want to see in the main content window.
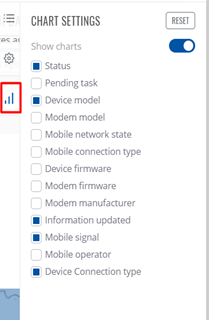
The tab for Chart options provides you with options to select the different charts you want to be displayed on the top of your screen.
 |  |  |
Settings panel and search field
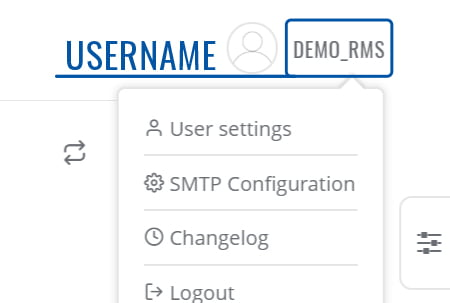
In the top right corner, you will find the settings panel. Here you will see your username and clicking on it will open a dropdown menu with Settings, SMTP configuration, Changelog and the option to Log out. In the settings panel, you will find user and profile settings.
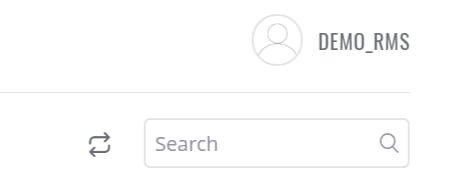
The Search field is located just below the settings panel. You can use the search field to filter devices by the information in name, description, serial, mac and other columns.
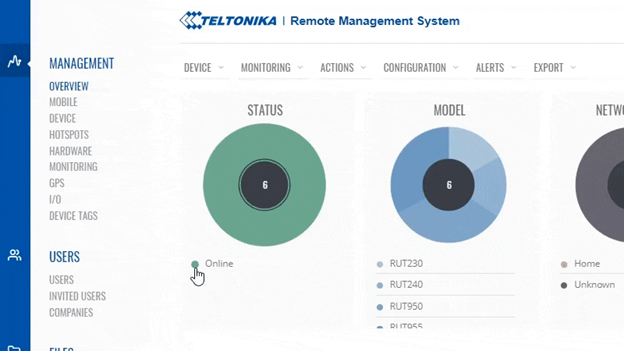
For a user with Read only rights, the most important section is located on Left Side Bar - Management - Devices
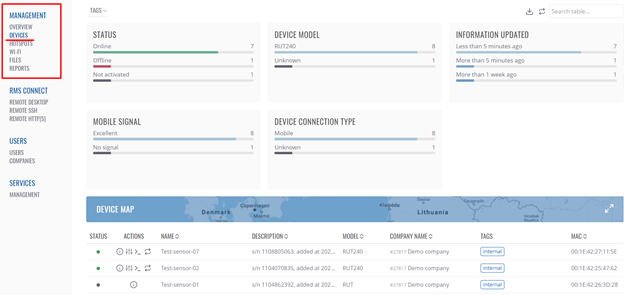
View of this section below in the picture
General information about all devices of the company - you can look at the charts
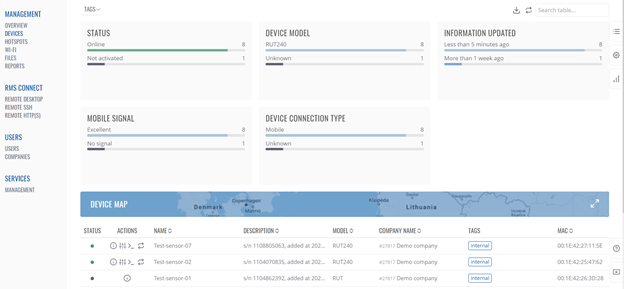
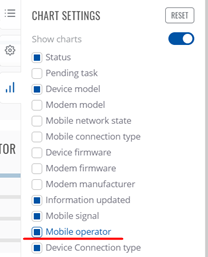
These charts can be customized (display only the necessary indicators) using the capabilities of the Right customization panel
Example of using charts:
For example, we will add information about mobile operators
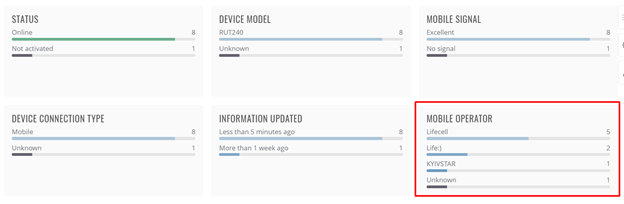
The setting will be applied immediately and it will be possible to see which mobile operators are currently being used on the sensors:
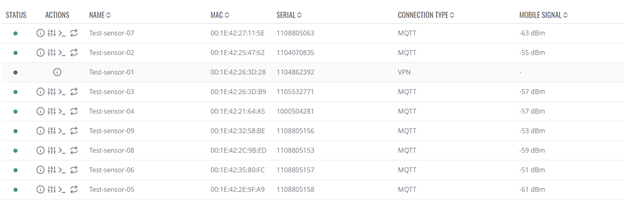
More details can be found in the Main content window (Shows all the data and corresponds to your selection on the left sidebar panel and customization of the right panel.)
It displays all the sensors belonging to the company, as well as information about them (such as MAC address of the sensor, model of the sensor and etc.) - for convenience in this window you can configure additional information about the device, as you need, using the Right customization capabilities panel
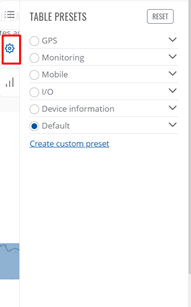 | There are already configured groups of parameters there, you can also configure only those that you need |
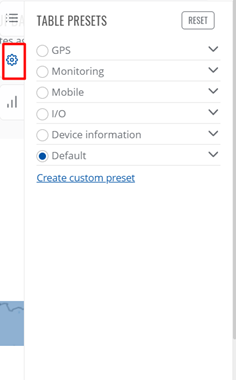
Example of use of Table Preset:
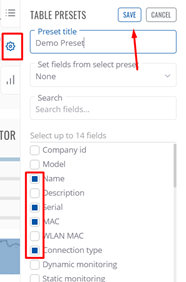 | We will create a test Preset with the name Demo Preset in which only the parameters Name, Serial, MAC, Connection type, Mobile signal will be displayed |
When choosing our Preset, we will receive - only the fields we selected
! In total, you can select up to 14 parameters for displaying in Preset
You can get more detailed information by clicking on the “i” icon next to the sensor you are interested in.
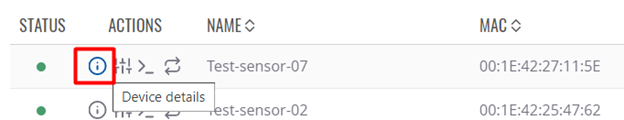
Example of Device information window below
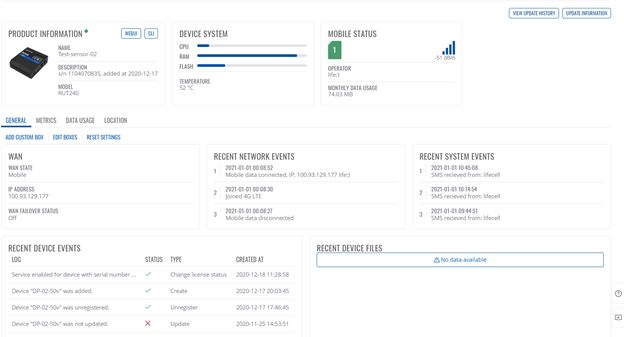
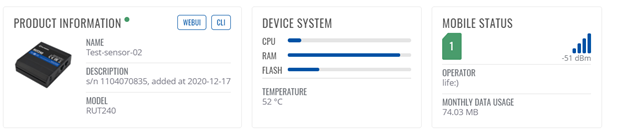
At the top, you can see the basic information about the sensor
In the center of the screen, there are several tabs that can be used to get the necessary information
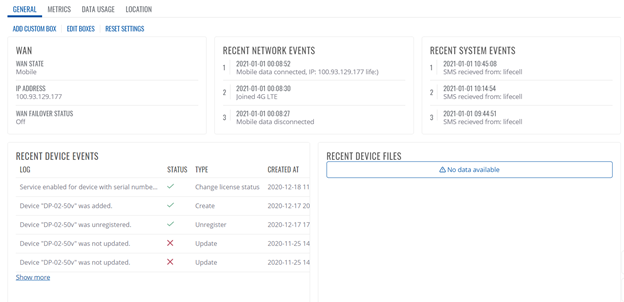
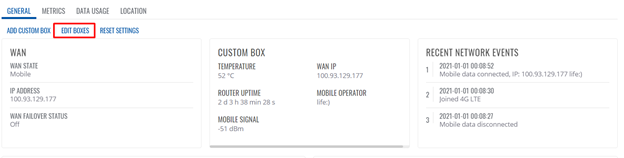
General - the main view, which is divided into boxes (boxes), it can be customized by changing existing Boxes or adding new ones.
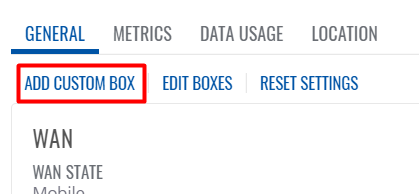
An example of adding a new Box - add a custom box
Choose the settings you need to display (you can select up to 8 parameters per Box)
We will choose the following options temperature, WAN IP, Router uptime, Mobile operator, Mobile signal
Using the Edit Boxes button, we can move the Box we created to the position we need, as in the picture below
Metrics is a tab where you can see the sensor data we're interested in for a certain period (the period is indicated by the user himself, by default it is the current day)
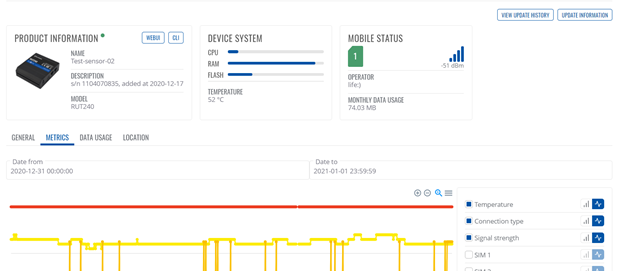
The data is displayed in the case when the sensor was connected to RMS
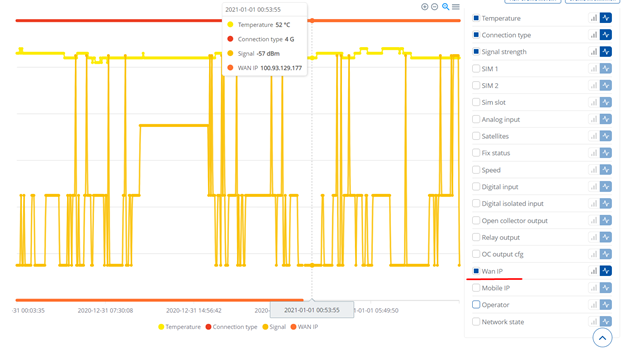
Here you can also select parameters to display on the chart
For example, we add a Wan IP display on the graph
Data usage - a tab on which you can see the traffic used for a certain period
Example
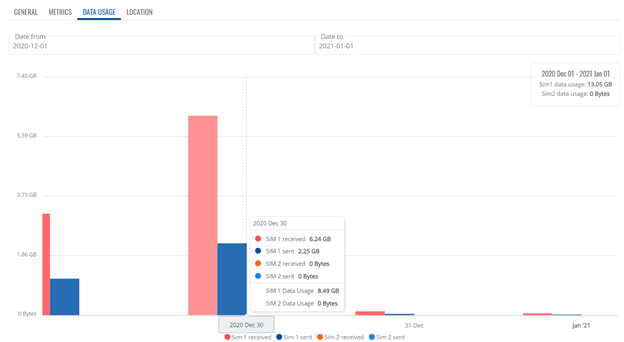
Location - on this tab you can see the location of the sensor on the map. If the sensor does not have a GPS sensor, your administrator could set this info manually
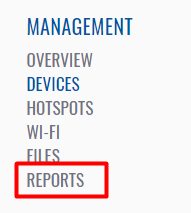
Reports
Users with the read only rights can view already created and generated reports for the company by administrators
Left sidebar panel - Management - Reports
At the main window, you can find created reports by Administrators
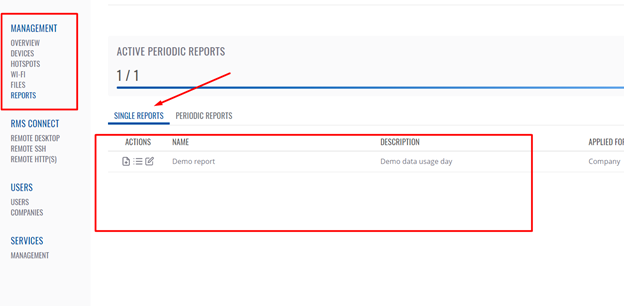
Users can view reports by clicking on the report
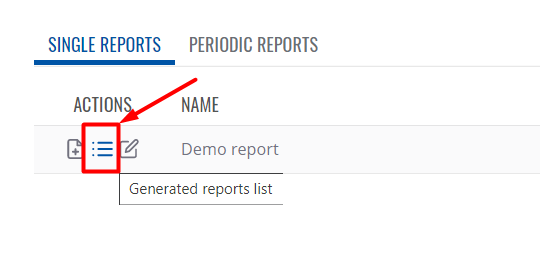
and choose the needed report
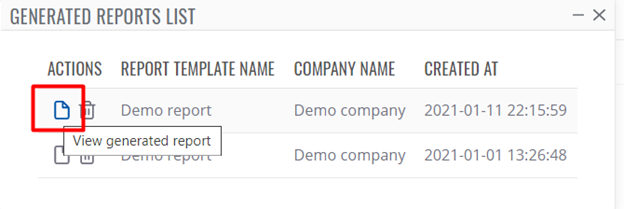
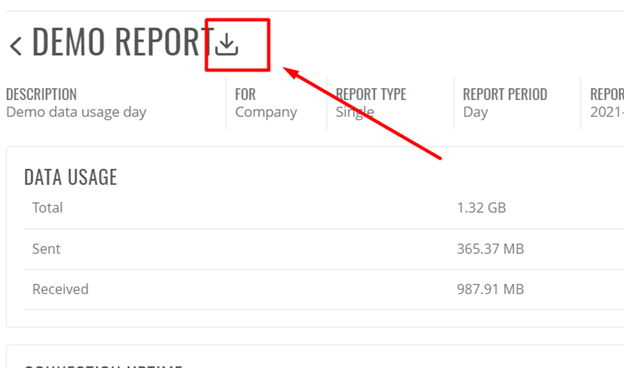
Example of the generated report
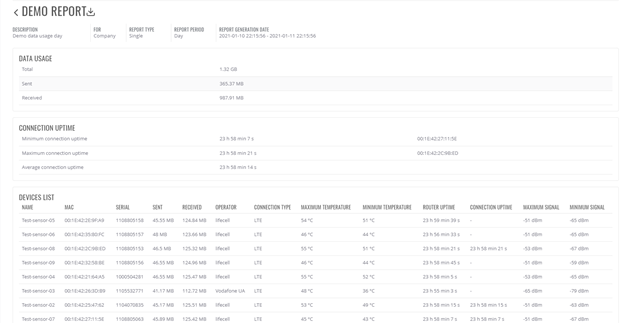
This report can be download in pdf by clicking on the download icon